The Google Business
Profile Report –
Automotive Edition
2025 Edition | Conducted by SearchLab Digital
Introduction

Hey, I’m Greg Gifford
And I’m pumped to bring you the 2025 edition of the largest automotive SEO study ever conducted.
This year’s version is bigger, better, and loaded with more data points than ever before.
Lots of highlights are below, but if you’re a data nerd like me and want the full study (plus a handy checklist for your GBP), you can grab it here.
Buckle up, here we go…
Here’s the deal:
We wanted to see if the stuff we all say matters for automotive SEO actually influences real-world visibility. Do the dealerships sitting at the top spot really follow best practices more closely than the ones stuck at the bottom of the map pack?
Or are there cases where the data tells a different story?
Instead of drowning you in SEO theory, we went Straight to the source:
Actual search results. We calculated industry averages and compared dealers ranking #1 to dealers at #10 to see how much of a difference best practices really make.
And yeah, a lot of the numbers lined up exactly like you’d expect. Do things better, rank higher. But there were also a few surprises that went against the grain. I’ll point those out along the way so you can see where the assumptions don’t quite hold up.
SUMMARY & KEY STATS
The short version:
Dealerships are making progress with optimization, but there are still plenty of missed opportunities.
Some of the numbers are encouraging, like the fact that the average dealership now has over 2,000 reviews with a 4.3-star rating.
Others… not so much. Almost half of dealers still haven’t set up Service and Parts GBPs, and 83% of dealerships don’t use all 10 category slots.
Here’s a quick snapshot of where things stand in 2025:
47%
Of dealerships still don’t have separate GBPs for service and parts.
17%
Are using all 10 available GBP categories
2.5 Sec.
Is the average load time for a dealership's homepage
21%
Of dealerships are missing AutoDealer schema on their website
2,195 Reviews on Google
With an average rating of 4.3 stars
So yeah, there’s progress, but there’s also plenty of low-hanging fruit most dealers still aren’t grabbing.
HOW WE CONDUCTED THIS STUDY
This isn’t based on surveys or guesswork. It’s built on hard data.
We used Places Scout (the best Local SEO tool available) to run searches for six dealership keywords:
“Chevrolet dealer”
“Ford dealer”
“Toyota dealer”
“Jeep dealer”
“Kia dealer”
“Used car dealer”
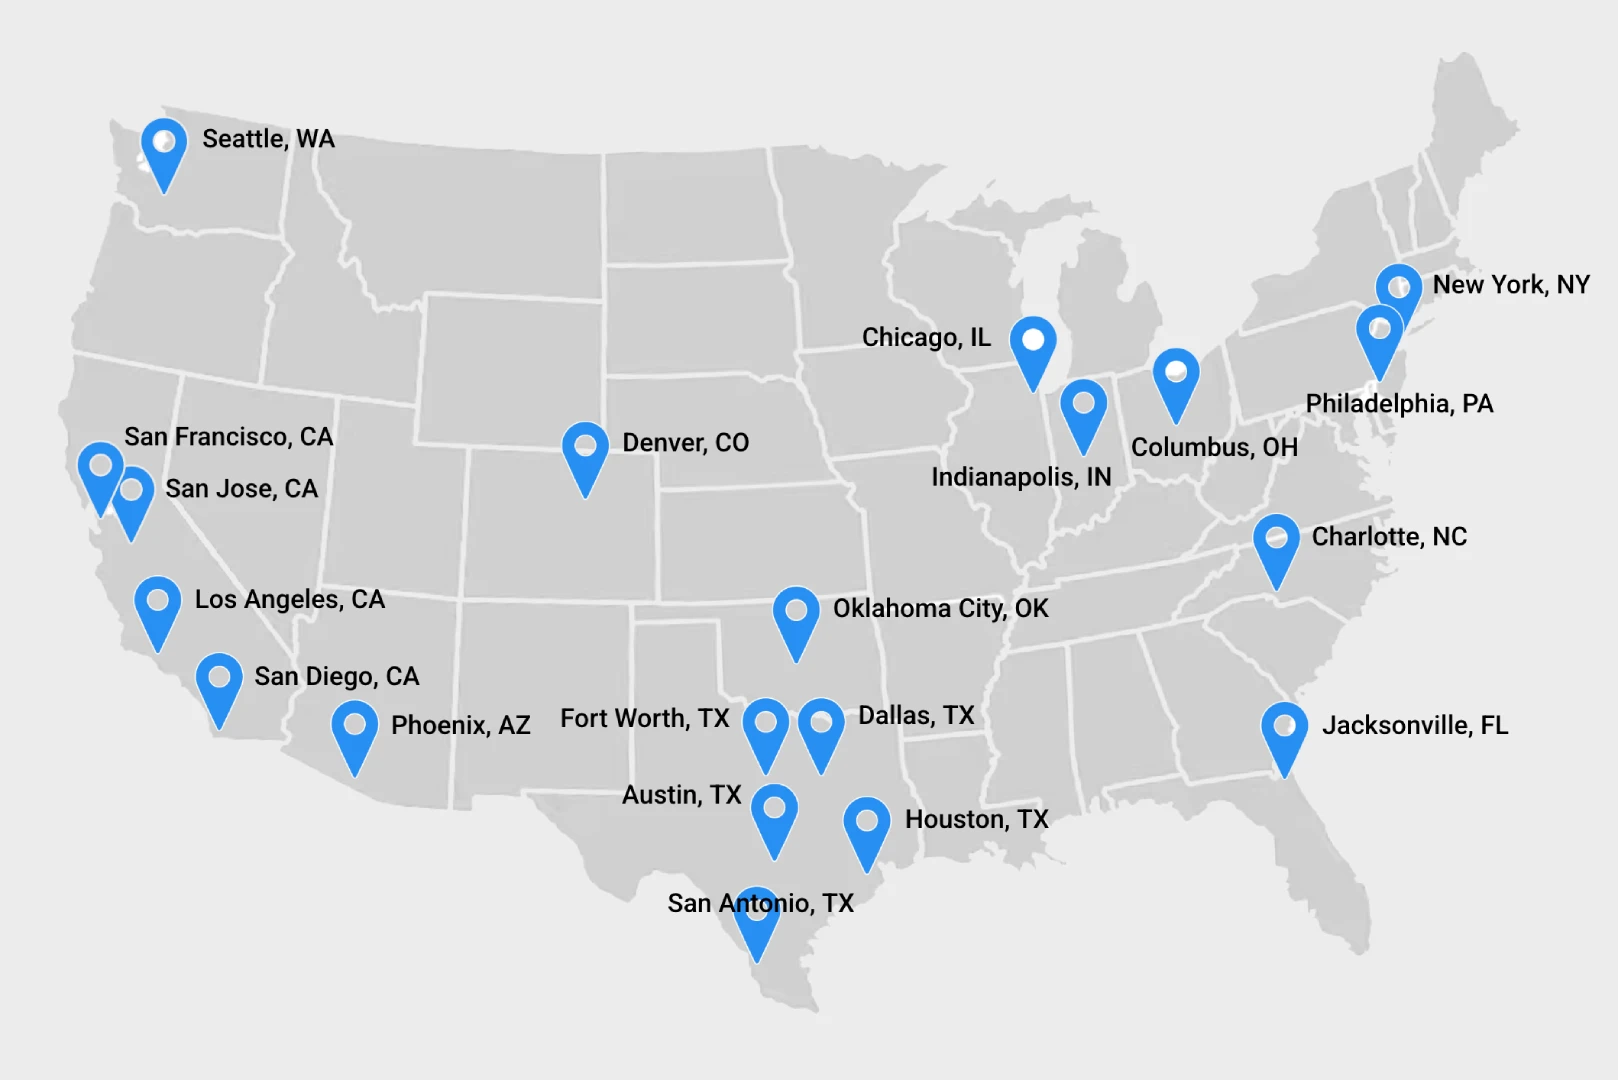
In 20 major U.S. cities:
One Final Note:
Since Google removed the Q&A feature from Business Profiles earlier this year, Q&A data was not included in this study.
The Local Finder is the page that looks like Google Maps and appears when you click “More locations” at the bottom of the map pack.
That gave us 2,400 GBPs. After removing Service and Parts department profiles, we ended up with 2,260 dealerships in the final dataset.
Then, we brought in Ahrefs to analyze backlink and visibility data. Throughout the report, you’ll see references to Whitespark’s Local Search Ranking Factors (LSRF) so you can see how individual data points were weighted in the most recent edition.
AVERAGES AND RANKING COMPARISONS
We looked not only at industry averages, but also head-to-head comparisons between dealerships ranking #1 and #10 in the map pack. This allowed us to see if the dealerships at the top were actually doing things better or if some factors didn’t match expectations.
Where results didn’t align with expectations, we’ve flagged those anomalies and added context to explain why.
This dual view, Industry Averages + Ranking Comparisons, gives you both the 30,000-foot perspective and the tactical detail to benchmark against competitors.
COLOR CODING & CAVEATS
A quick heads up before you dive into the data…
We pulled a massive amount of info from each dealership’s Google Business Profile, but not every data point you’ll see here is a direct ranking factor. Some things influence visibility (how often you show up), while others influence conversions (how often customers click, call, or visit).
To make this easier, we’ve marked each factor with an icon:
This study isn’t about assigning weight to ranking factors, nobody outside of Mountain View can do that. Instead, it’s about showing whether the data supports the best practices everyone talks about.
A few other notes to keep things clear:
From here, the report breaks down each major area of GBP optimization, photos, reviews, technical site factors, schema, content, links, and keywords with data tables, explanations, and actionable best practices.
Alright, enough of me yappin’. Let’s get to the good stuff:
Core GBP Setup & Management
These are the foundational elements of your Google Business Profile. If these aren’t done right, your dealership is already at a disadvantage in search.
Profile Set Up
Why it matters:
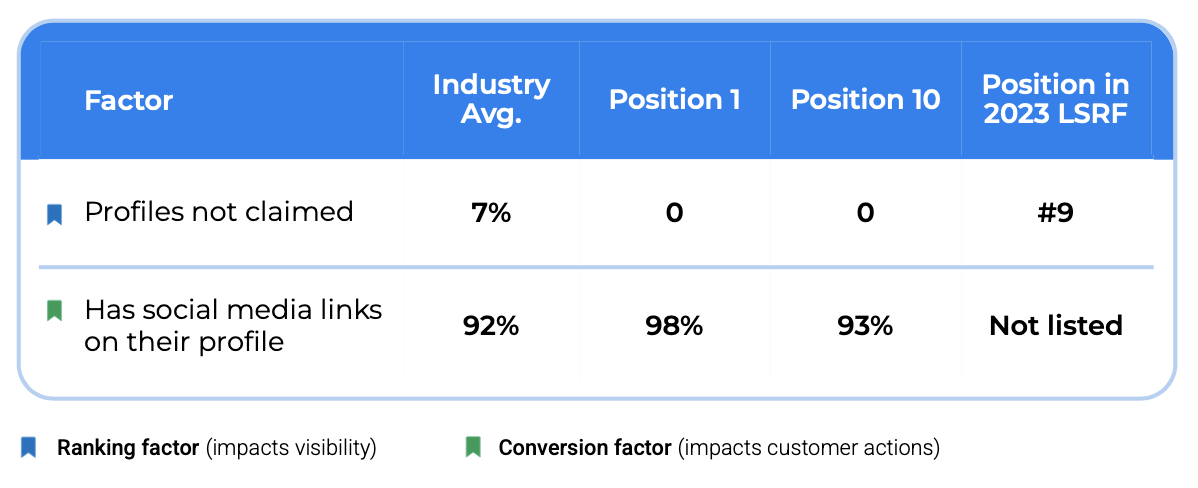
An unclaimed profile can’t be fully managed, meaning no edits, posts, or review responses, which immediately puts a dealership at a disadvantage. Social media links reinforce credibility and give customers more ways to engage.
Best Practice
Greg Gifford
Chief Operating Officer

Every dealership should claim and verify all of their GBPs, including department profiles, to ensure they’re in full control. Social media links should always be added to showcase an active and trustworthy presence.
Google Posts
Factor | Industry Avg. | Position 1 | Position 10 | Pos. in 2023 LSRF |
|---|---|---|---|---|
Avg. posts in the last 12 mo | 45 | 38 | 31 | #76, #129, #132, #135, #140 |
Avg. posts per month | 2 | 3 | 2 | #76, #129, #132, #135, #140 |
Oldest post date | 2820 days | --- | --- | --- |
Why it matters:
Regular posting helps you stand out from the competition and drives pre-site conversions. Position 1 dealers post more often than those at position 10. Dealerships averaged just under 4 posts monthly.
Best Practice
Greg Gifford
Chief Operating Officer

Publish weekly Google Posts to highlight specials, events, or inventory updates. Posts should be compelling and promotional. Don’t treat Posts like social media. They’re free ads that appear on your Profile.
Want more info? Download the full study that includes even more data AND a practical checklist to help you make the most out of your Google Business Profile Listing.
Website Links on GBP
Factor | Industry Avg. | Position 1 | Position 10 | Pos. in 2023 LSRF |
|---|---|---|---|---|
No website listed | 2% | 0% | 0 | #26, #27, #47, #53, #66, #80 |
Has an appointment link | 62% | 70% | 62% | Not listed |
Has a link to products and services | 56% | 71% | 56% | Not listed |
Why it matters:
Customers need to see your site to decide if they want to buy from you or service with you. Fifty-four of the profiles in the study didn’t list a website. It’s also incredibly helpful for a customer to click on an appointment link and view products and services from the GBP.
Best Practice
Greg Gifford
Chief Operating Officer

Always list your website. Bonus: use proper UTM tracking (see UTM Tracking Overview section) so you don’t lose attribution.
UTM Tracking Overview
Why it matters:
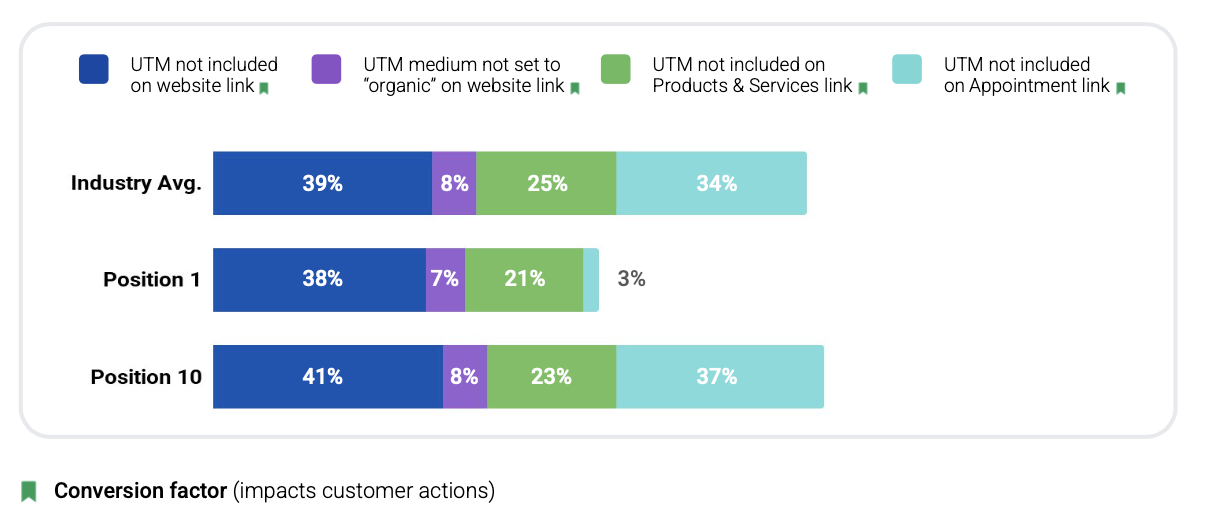
When UTM tracking is missing, a large portion of GBP-driven organic traffic gets misattributed as “direct” in Google Analytics, making it impossible to know what’s really working. Even worse, when UTMs are added incorrectly, Google Analytics Data is actively polluted, which leads to bad reporting and poor decisions.
Best Practice
Greg Gifford
Chief Operating Officer

Every dealership should add UTM parameters (source and medium are required to function properly) to all GBP website links, and always set the medium to “organic” (with a lower-case “o”). This ensures proper attribution in Google Analytics, avoids data pollution, and allows you to measure which actions are truly driving results.
Check out these Local Search Tuesday Videos showing how to optimize your Google Business Profile and tips to set up UTM tracking correctly.
Automotive GBP Factors
These factors are unique to dealerships. Google literally changed the rules just for dealers. They don’t just help with visibility, they directly impact customer engagement and conversions. Too many dealers are still missing these easy wins.
Doesn’t Have Vehicles for Sale (VFS)
Factor | Industry Avg. | Position 1 | Position 10 |
|---|---|---|---|
Profiles missing VFS | 29% | 13% | 31% |
Has products listed on their profile | 16% | 23% | 18% |
Why it matters:
29% of the dealerships in the study did not have Vehicles for Sale displayed on their GBP. Google added Vehicles For Sale (VFS) almost 8 years ago (called Cars for Sale at the time), and research has proven that VFS can have a big influence on GBP conversions.
Best Practice
Greg Gifford
Chief Operating Officer

Enable Vehicles for Sale. It displays your live inventory and drives more customer actions before they even hit your website
Not Listing Department Profiles (Service & Parts)
Factor | Industry Avg. | Position 1 | Position 10 |
|---|---|---|---|
Dealers without dept. GBPs | 47% | 38% | 48% |
Why it matters:
Separate profiles for Service and Parts allow you to target more categories and appear in more searches. Many dealers still miss this easy win. Used car dealers rarely create department profiles (since most don’t do service), and if we remove them from the data, the number drops to 36%, meaning 1 in 3 franchise dealerships still haven’t set up department GBPs.
Best Practice
Greg Gifford
Chief Operating Officer

Set up Service and Parts Profiles and nest them under the main dealership GBP. More profiles = more search visibility.
Pretty cool info so far, right? Get even more when you download the full study that includes even more data AND a practical checklist to help you make the most out of your Google Business Profile Listing.
Categories
Categories are one of the most weighted ranking factors in Google’s local algorithm. The primary category tells Google exactly what your business is, while secondary categories expand your visibility into related searches.
Categories Overview
Factor | Industry Avg. | Position 1 | Position 10 | Pos. in 2023 LSRF |
|---|---|---|---|---|
Unique primary categories | 19 | 9 | 15 | #1 |
Unique categories selected | 121 | 51 | 61 | #7 |
Why it matters:
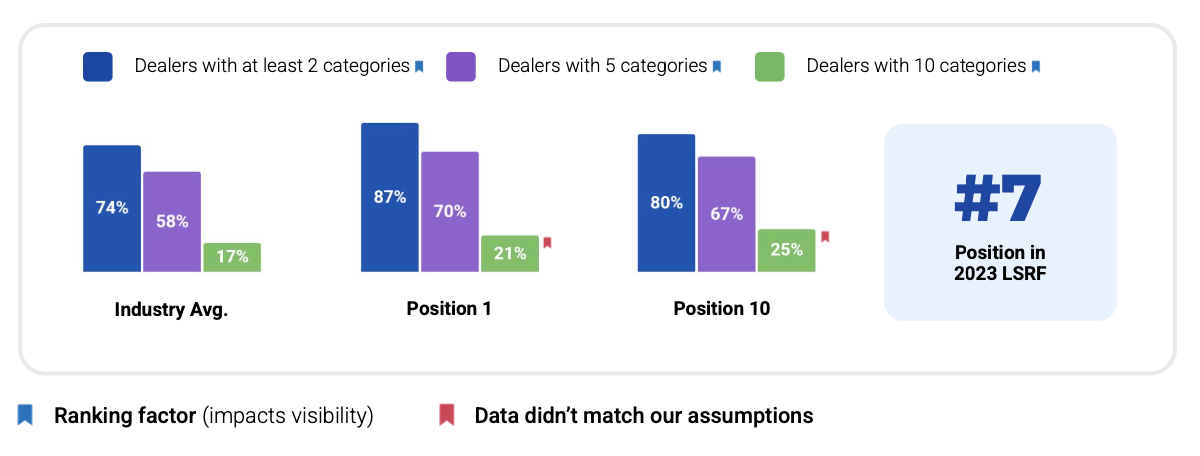
The primary category is the most influential ranking factor for dealerships (ranking #1 in the 2023 LSRF study). We should have only seen 6 unique primary categories, since dealers should have selected either “[brand] dealer” or “used car dealer” as their primary category. Instead, we saw 19 unique primary categories, showing that many dealers are selecting incorrect categories that hinder their visibility in searches.
Secondary categories expand your search coverage, and dealers in the top spots consistently select more relevant categories than those further down. There are more than 10 categories related to car sales, so dealerships should always have 9-10 selected.
Don’t get your categories wrong. Adding irrelevant categories can hurt visibility and confuse Google, making it harder for your dealership to appear in the right searches.
Note
Greg Gifford
Chief Operating Officer

We’re not totally sure what’s going on with the “Dealers with 10 categories” Position 1 and Position 10 data. Maybe a few of the Position 10 dealers were trying harder, but if that were really the case, we’d expect to see them beating Position 1 on other factors too (like number of categories). Most likely it’s just a couple of weird outliers throwing things off.
Best Practice
Greg Gifford
Chief Operating Officer

Every dealership should begin by getting the primary category correct. Instead of choosing the more generic categories like “Car dealer,” use precise and relevant categories such as “[brand] dealer” or “Used car dealer.” Once the primary is correct, dealerships should maximize visibility by filling out all available category slots with relevant options. Franchise dealers should never have fewer than nine or ten categories selected.
Photos
Photos don’t directly impact your rankings, but they have a massive influence on conversions. Customers use them to judge trust, quality, and whether they want to visit in person.
Photos Overview
Factor | Industry Avg. | Position 1 | Position 10 | Pos. in 2023 LSRF |
|---|---|---|---|---|
Avg. number of photos | 311 | 499 | 345 | #82, #106 |
Avg. age of most recent photo | 153 days | 86 days | 145 days | #82, #106 |
Avg. age of most recent | 823 days | 821 days | 823 days | #82, #106 |
Why it matters:
Dealers ranking in Position 1 have significantly more photos, with an average of about 150 more than those in Position 10. The oldest photo upload date was back in 2018 and the oldest photo upload date by the owner was in 2013.
Freshness also plays a key role, since top dealers tend to have newer images thanks to both customer uploads and consistent updates. When photo galleries sit untouched for years, it makes a dealership look inactive and untrustworthy, which reduces customer engagement.
Best Practice
Greg Gifford
Chief Operating Officer

Dealerships should maintain a large, high-quality library of photos that includes facilities, staff, and service areas. It’s important to upload new photos regularly to keep the gallery looking active and relevant. Encouraging customers to add their own photos through reviews or direct location tagging can also help maintain freshness and credibility. Above all, avoid letting years pass between uploads, since outdated images send the wrong signal to both Google and potential buyers.
Reviews
Reviews are one of the strongest signals in local search, impacting both visibility and customer trust. The quantity, quality, recency, and responsiveness of reviews all play a role. Dealers who actively manage their reputation not only tend to rank higher but also win more customers.
Reviews Overview
Factor | Industry Avg. | Position 1 | Position 10 | Pos. in 2023 LSRF |
|---|---|---|---|---|
Avg. Google review count | 2,195 | 3,386 | 1,885 | #8, #40 |
Avg. Google rating | 4.3 | 4.4 | 4.3 | #6 |
Avg. new reviews per month | 29 | 37 | 26 | #13, #20 |
Avg. new reviews last year | 350 | 450 | 307 | #8, #13, #20 |
Reviews not responded to | 21% | 35% | 17% | #111 |
Avg. rating in last 12 months | 4.2 | 4.4 | 4.2 | #6 |
% of positive reviews (4–5 stars) | 84% | 84% | 84% | #6 |
% of negative reviews (1–3 stars) | 18% | 17% | 17% | #6 |
Avg. review response time | 7 days | 6 days | 9 days | #111 |
Why it matters:
Reviews influence both how often a dealership shows up in Google’s map pack and how many customers choose to click or call.
Dealers ranking in Position 1 had nearly double the number of reviews compared to those at Position 10, confirming that volume makes a difference. Ratings also matter, with the sweet spot typically between 4.4 and 4.7 for balancing trust and visibility.
Recency is another factor: top dealers earn new reviews more consistently, which signals ongoing activity to both Google and customers. However, the study revealed a surprising gap: Position 1 dealers actually responded to fewer reviews than those at Position 10. It’s been best practice for years to respond to customer reviews, so it was surprising to see that nearly 1 out of 5 reviews had no owner response. Regardless of ranking, ignoring reviews damages credibility and customer relationships.
Note
Greg Gifford
Chief Operating Officer

We actually expected the opposite data with the “Reviews Not Responded To” for position 1 and position 10. Odds are the Position 10 dealers were just trying harder on this one factor.
Best Practice
Greg Gifford
Chief Operating Officer

Dealerships should build a steady system for collecting new reviews each month, aiming to outpace competitors in their market rather than chasing arbitrary numbers. Maintaining a rating between 4.4 and 4.7 is ideal, and consistent recency shows both Google and customers that your dealership is active and engaged.
Equally important is responding to reviews. Every review, positive or negative, deserves a timely reply. Businesses that respond within 24 hours not only build stronger customer trust but also send positive engagement signals. Long delays, or failing to respond at all, can undo the benefits of having a large review volume.
Dig this so far? Download the full study that includes even more data AND a practical checklist to help you make the most out of your Google Business Profile Listing.
Technical Website Factors
These behind-the-scenes elements impact both visibility and customer experience. Speed, security, and mobile responsiveness may not feel as obvious as reviews or categories, but they play a huge role in how Google, and your customers, judge your dealership online.
Technical Website Factors Overview
Factor | Industry Avg. | Position 1 | Position 10 | Pos. in 2023 LSRF |
|---|---|---|---|---|
Website phone matches GBP phone | 39% | 35% | 44% | Not listed |
Avg. page load time | 2.5 sec. | 1.6 sec. | 1.6 sec. | #53, #79 |
Slowest page load time | 111 sec. | --- | --- | --- |
Fastest page load time | 0.08 sec. | --- | --- | --- |
Website not responsive | 15% | 17% | 13% | #41 |
Website not HTTPS | 18% | 18% | 20% | #59 |
Why it matters:
Dealers with faster-loading, mobile-friendly, and secure websites create better experiences for customers and stronger signals for Google. In this study, average page load times were nearly identical for Position 1 and Position 10 dealers, but the extremes told the story: some sites loaded in fractions of a second, while others took nearly two minutes, an immediate conversion killer.
Responsiveness is another critical factor. With most automotive customers browsing on mobile, a non-responsive site creates frustration and directly impacts rankings after Google’s Page Experience Update (which rolled out in 2021).
Similarly, HTTPS has been a ranking signal since 2014 and was updated in the algorithm as part of the Page Experience Update, yet nearly one in five dealership sites still lacked it.
Finally, consistency between the GBP phone number and the website phone number matters less today than it once did, since call tracking numbers are now best practice, but unintentional mismatches can still create confusion.
Note
Greg Gifford
Chief Operating Officer

Dealer.com is still the only website platform that isn’t responsive. While responsiveness is a signal, it’s not a deal breaker. Strong optimization in other areas can offset it, which is why some non-responsive sites are still sitting at #1.
Best Practice
Greg Gifford
Chief Operating Officer

Every dealership should monitor and do what they can to improve website speed to stay competitive, with the goal of keeping load times under three seconds. Websites must be fully responsive to deliver a seamless mobile experience, and sites should be secured with HTTPS to build trust and meet Google’s baseline requirements. While exact phone number matches between GBP and the website are no longer mandatory, consistency should be intentional. If a tracking number is used, ensure it’s implemented correctly.
Schema & Markup
Schema is a type of structured code that helps Google understand your business and display richer search results. For local businesses, the LocalBusiness schema is vital. Car dealers should have AutoDealer schema on their home page (a more specific subset of LocalBusiness). Correct schema usage improves how your site appears in search and will only grow in importance as Google leans into AI-powered search results.
Schema & Markup Overview
Factor | Industry Avg. | Position 1 | Position 10 | Pos. in 2023 LSRF |
|---|---|---|---|---|
No AutoDealer schema markup | 21% | 18% | 23% | #98 |
More Than One Type of Local Business Schema Present | 33% | 33% | 30% | #98 |
Why it matters:
1 out of 5 dealership sites in the study didn’t have the correct LocalBusiness schema markup. Schema sends a clear, machine-readable signal to Google about your dealership. When the wrong schema is used, or when AutoDealer schema is missing entirely, search engines get conflicting information, which can hold back visibility. As Google rolls out more AI-powered search features, structured data is becoming even more critical in determining which businesses appear in those results.
Best Practice
Greg Gifford
Chief Operating Officer

Every dealership should include AutoDealer schema on the homepage and ensure it’s the only LocalBusiness schema type on that page. Using multiple or incorrect schema types dilutes the signal and can confuse Google’s understanding of the site. Implementing schema correctly not only helps with visibility but also enhances how your listings display in search, supporting higher click-through rates.
Content Optimization
Your content needs to pull double duty: answer your customers’ questions and signal relevance to Google. The right mix of text, images, keywords, and location signals helps your dealership show up in search results while also converting visitors once they land.
Content Optimization Overview
Factor | Industry Avg. | Position 1 | Position 10 | Pos. in 2023 LSRF |
|---|---|---|---|---|
Avg. Images on homepage | 35 | 40 | 34 | #102, #126 (loosely) |
Avg. words on homepage | 1337 | 1613 | 1522 | #71 |
Zero words on homepage | 10% | 0 | 0 | #71 |
Why it matters:
Dealership websites are naturally image-heavy, but without supporting text content, customers have no insight into the business and Google has nothing to index and rank. In this study, 11% of dealerships had zero text on their homepages, relying only on images.
That’s a major missed opportunity for search visibility. Dealers ranking in the top positions generally had more balanced pages with both images and meaningful content.
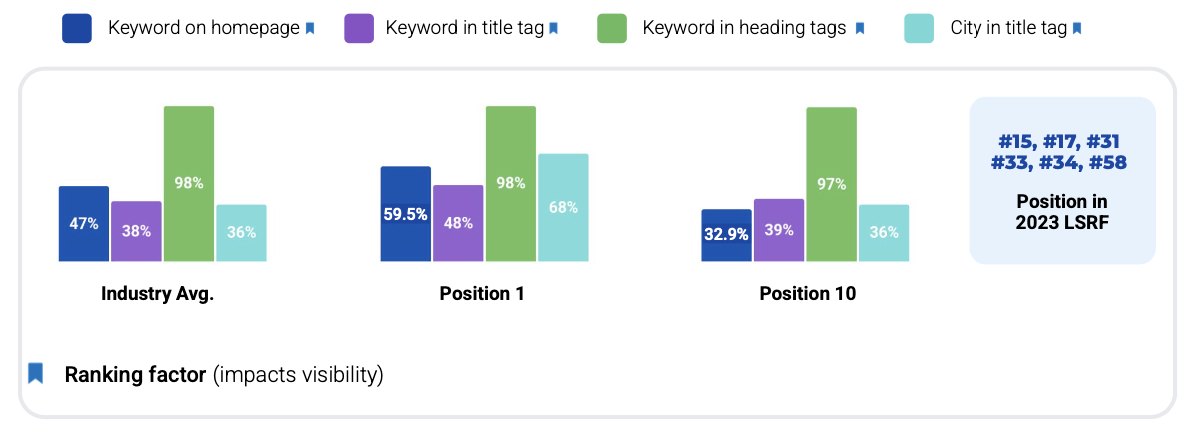
Optimization also plays a critical role. Dealers in Position 1 were much more likely to include the searched-for keyword on the homepage, in title tags, and in heading tags compared to those in Position 10. The inclusion of the city name in the title tag was another clear differentiator, with 68% of Position 1 dealers doing so versus just 36% of those at Position 10.
These signals reinforce relevance and strengthen local ranking.
Best Practice
Greg Gifford
Chief Operating Officer

If you want to show as a search result when someone types something into Google, you need a page about that singular concept on your site. That page needs to be the best answer in the local area to the question the user is asking. That’s tough to do with the standard 450-500 words most providers offer.
Every dealership should aim to include at least 800–1,000 words of well-written, customer-focused content on their homepage. This content should naturally include relevant keywords and location signals, while also answering the questions customers are most likely to ask. Images should complement, not replace, this content.
Optimizing title tags, headings, and homepage copy with both brand and city information remains essential. By optimizing every page element for the same keyword and location, dealers make it clear to Google what they sell and where they sell it. The goal is to provide a complete, relevant, and helpful page experience that satisfies both search engines and customers.
Links
Links remain one of the strongest signals Google uses to decide which websites deserve to rank higher. But it’s not just about how many links you have, it’s about where they come from. For dealerships, a handful of quality, relevant, and local links will always outweigh thousands of spammy or irrelevant ones.
Links Overview
Factor | Industry Avg. | Position 1 | Position 10 | Pos. in 2023 LSRF |
|---|---|---|---|---|
Avg. number of inbound links | 4,386 | 4,430 | 2,927 | #19, #21, #27, #32, #47, #50, #66 |
Avg. number of unique linking domains | 184 | 220 | 186 | #19, #21, #27, #32, #47, #50, #66 |
Largest link-to-domain gap | 3,917,633 | --- | --- | --- |
Why it matters:
Dealers ranking in Position 1 consistently had more inbound links and more unique referring domains than those at Position 10, confirming that links remain a powerful ranking factor. However, not all links are equal. A dealership with millions of spammy inbound links may still struggle to rank compared to one with a smaller number of relevant, trusted, and local links.
The study also revealed diminishing returns when multiple links come from the same domain. We subtracted the number of unique linking domains from the total number of inbound links to get the link-to-domain difference for each site.
The biggest difference was for a Toyota dealership that had 3,918,144 links from only 511 unique websites!
Quality and diversity matter more than sheer volume. A balanced link profile with a wide mix of referring sites is a far stronger indicator of authority than one inflated by spammy or repetitive sources.
Best Practice
Greg Gifford
Chief Operating Officer

Dealerships should prioritize building local links from businesses and websites in the same local area and trusted industry sites. The focus should be on earning links that are both credible and connected to the dealership’s local market. The number of unique referring domains is more important than the total link count.
Over time, dealers should audit their backlink profiles to identify and address spammy or irrelevant links. By steadily increasing the diversity of quality inbound links, dealerships can send stronger signals to Google and maintain more stable rankings.
Keywords
Keywords are the search terms your website actually ranks for in Google. The more relevant keywords you rank for, especially in the top spots, the more opportunities you have to attract new customers. Top-performing dealers tend to cover more keyword ground and show up for the phrases that matter most, while lower-ranking dealers often miss these basics.
We used ahrefs for link analysis, and one of the features of the tool is a calculation of how many keywords each URL ranks for (according to ahrefs data). The system also assigns an “organic cost” number.
This number is calculated by looking at the ranking position for a keyword and assuming a percentage of total search volume based on ranking position. The system then cross-references the keyword with PPC data, calculating an “organic cost”, Basically, how much a dealer would have to spend on PPC to buy the same amount of traffic.
Keywords Overview
Factor | Industry Avg. | Position 1 | Position 10 |
|---|---|---|---|
Avg. ranking keywords | 2,636 | 4,455 | 1,855 |
Avg. keywords in top 3 | 69 | 104 | 57 |
Organic Cost | $281,398 | $461,934 | $216,731 |
Why it matters:
On average, dealers would need to spend over $245,000 a month with PPC to get the same amount of traffic they’re getting with organic search.
The biggest shock of the study is the gap in organic cost between dealers at Position 1 and dealers at Position 10. To make up for less visibility, lower-ranking dealers would need to spend over $245,000 monthly!
Dealers in Position 1 ranked for more than twice as many keywords overall compared to those in Position 10. This shows that consistent optimization across GBP, website content, and technical factors expands keyword coverage. The more relevant keywords a dealer ranks for, the more chances they have to capture traffic and generate conversions.
One interesting insight: according to Google, about 20% of daily search queries have never been searched before. That means it’s nearly impossible to track every keyword you might rank for.
Instead, the focus should be on building high-quality content and optimizing for the terms that matter most to customers. When done correctly, rankings for new and unexpected keyword variations naturally follow.
Best Practice
Greg Gifford
Chief Operating Officer

Dealerships should focus on creating content that aligns with customer needs and includes the key terms people are searching for both brand-related and local.
Optimizing GBP landing pages and homepage copy for these terms is critical. It’s not about chasing thousands of keywords individually but ensuring the site is structured, helpful, and comprehensive enough to rank for many related queries over time.
Did you love it? Want some more of it? Download the full study that includes even more data AND a practical checklist to help you make the most out of your Google Business Profile Listing.

